
Content Marketing KPIs That Actually Matter: The Complete Guide to Measuring Content Performance
Content marketing can generate traffic, build trust, attract leads, support sales, and increase revenue. But none of those outcomes can be understood properly if you measure the wrong things.
Many businesses still judge content performance by page views, social media likes, follower counts, or the number of articles published. These numbers can be useful for understanding reach, but they do not necessarily tell you whether your content is contributing to business growth.
The most useful content marketing KPIs connect content activity with measurable outcomes such as qualified traffic, engagement, leads, conversions, customers, revenue, and return on investment.
This guide explains the most important content marketing KPIs, what each metric means, why it matters, how to measure it, and how to build a practical content marketing dashboard.
What Are Content Marketing KPIs?
Content marketing KPIs, or Key Performance Indicators, are measurable values used to evaluate how effectively your content is achieving specific marketing and business objectives.
A KPI is more useful when it answers a business question.
For example:
- Is our content attracting the right audience?
- Are people finding our content through search?
- Are visitors actually engaging with our content?
- Are content visitors becoming leads?
- Which articles generate customers?
- How much revenue can be attributed to content?
- Is our content investment producing a positive return?
The important point is that there is no single KPI that works for every content marketing strategy.
A B2B company focused on generating sales leads may care most about qualified leads, pipeline, and revenue.
An ecommerce company may focus on organic revenue, product views, add-to-cart events, and purchases.
A publisher may prioritize returning users, engagement, subscriptions, and advertising revenue.
A SaaS company may track demo requests, free trials, product signups, paid conversions, and customer lifetime value.
Therefore, the best content marketing KPIs are determined by the goal of the content rather than by a universal list of metrics.
The Difference Between Content Metrics and Content KPIs
Not every metric you can measure should be treated as a KPI.
A metric is simply a measurable data point.
A KPI is a metric that has a meaningful relationship with an important business objective.
For example, suppose a blog post receives 100,000 page views.
That sounds impressive.
But if those visitors are not relevant to the business, do not engage with the website, do not become leads, and never purchase anything, the 100,000 views may have limited commercial value.
Now imagine another article receives only 5,000 visitors but generates 150 qualified leads and several customers.
The second article may be far more valuable to the business.
This is why content teams should avoid evaluating performance based on traffic alone.
The goal is not simply to produce more visitors.
The goal is to attract the right visitors and move them toward meaningful outcomes.
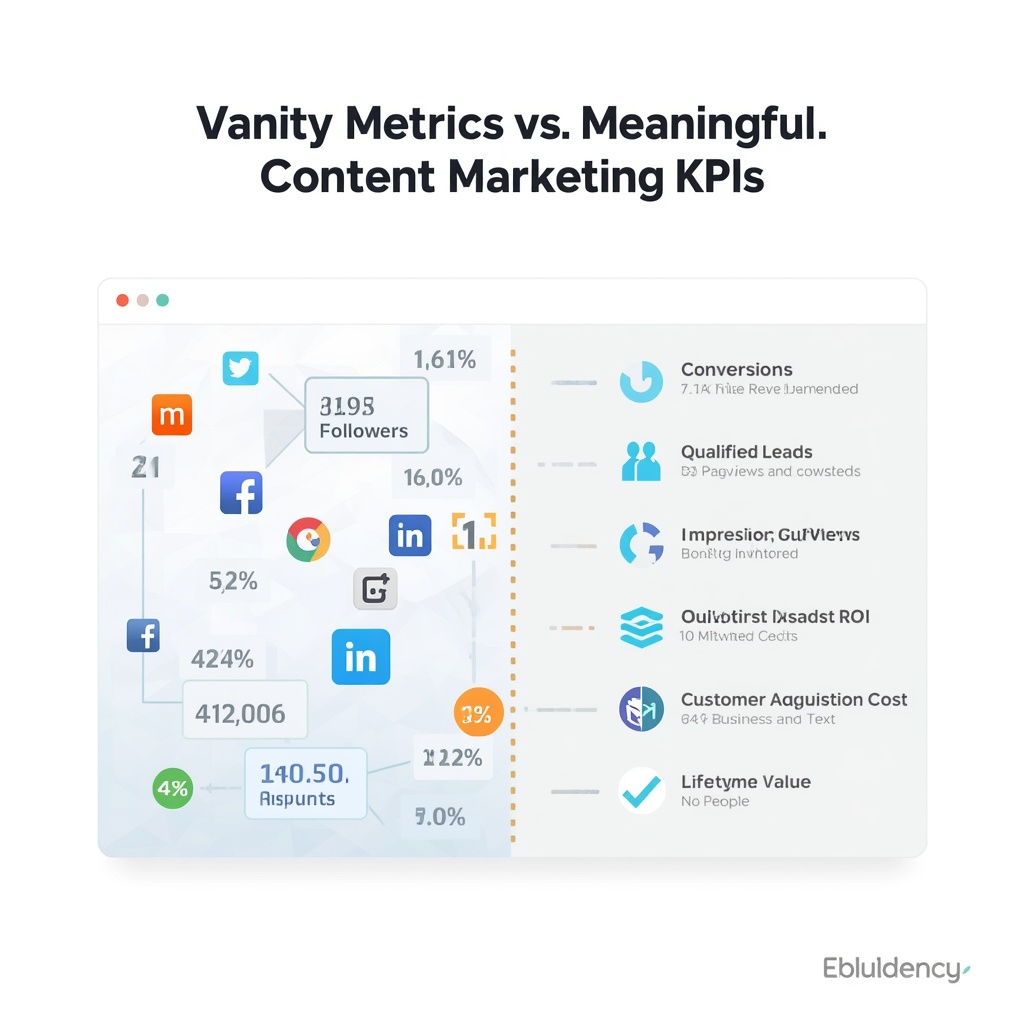
Vanity Metrics vs. Meaningful Content Marketing KPIs
Vanity metrics are not necessarily useless. They become problematic when marketers treat them as proof of business success without understanding what happens afterward.
Common Vanity Metrics
Some commonly overused metrics include:
- Page views
- Total followers
- Social media likes
- Social shares
- Blog comments
- Number of articles published
- Email subscriber count
- Total impressions
These numbers can provide useful context.
For example, impressions can show how widely content is being exposed, while page views can help identify which topics attract attention.
However, these metrics become much more useful when connected to deeper measurements.
Instead of asking:
“How many people viewed this article?”
Ask:
“How many relevant people viewed this article, engaged with it, clicked the next step, became leads, and eventually generated revenue?”
That question leads to much better content decisions.
Technical SEO Checklist for WordPress Sites
The Most Important Content Marketing KPIs
1. Organic Traffic
Organic traffic measures visits that arrive through unpaid search engine results.
It is one of the most common SEO and content marketing metrics because search visibility can generate a consistent source of website visitors over time.
However, organic traffic should not be evaluated in isolation.
A traffic increase is more meaningful when it comes with improvements in audience quality, engagement, conversions, or revenue.
Why Organic Traffic Matters
Organic traffic can show whether your content is gaining visibility for relevant searches.
It can also help identify:
- Which topics attract search demand
- Which pages are growing
- Which content needs improvement
- Which content generates qualified visitors
- Which search topics deserve additional coverage
How to Measure Organic Traffic
You can use Google Analytics to analyze traffic acquisition and Google Search Console to understand search performance.
Google Analytics provides information about traffic sources, engagement, key events, and revenue.
Google Search Console can be used to analyze search impressions, clicks, click-through rate, and average position.
What to Look For
Do not only track total organic sessions.
Break organic traffic down by:
- Landing page
- Topic
- Keyword
- Search intent
- Country
- Device
- New vs. returning users
- Content type
- Conversion performance
The most useful question is not simply whether organic traffic increased.
It is whether the increase represents traffic from people who are relevant to the business.
2. Keyword Rankings
Keyword rankings show where your content appears in search results for specific queries.
Rankings are useful because they help you understand search visibility and identify opportunities for optimization.
For example, a page ranking at position 11 may have a significant opportunity to reach the first page with additional optimization.
A page ranking at position 60 may require a much larger content, authority, or search-intent improvement.
Why Keyword Rankings Matter
Keyword rankings can help you:
- Monitor SEO progress
- Identify content opportunities
- Find declining pages
- Discover pages close to page one
- Compare competitors
- Evaluate content optimization
However, rankings should not be treated as the final business objective.
Ranking first for a keyword with almost no commercial value may produce less business impact than ranking lower for a highly relevant keyword.
How to Track Rankings
Popular tools include:
- Google Search Console
- Semrush
- Ahrefs
- Other rank-tracking platforms
Instead of tracking hundreds of keywords without context, group keywords by topic and search intent.
For example:
- Informational keywords
- Commercial investigation keywords
- Transactional keywords
- Navigational keywords
- Brand keywords
This makes ranking data much easier to interpret.
3. Search Impressions
Search impressions represent how often your content appears in search results.
Impressions can be especially useful when analyzing pages that receive visibility but relatively few clicks.
For example:
A page receives:
10,000 impressions
but only:
200 clicks
That produces a 2% click-through rate.
The problem may not be lack of visibility.
The problem may be that the search result is not attracting enough clicks.
This can lead you to investigate:
- Title tags
- Meta descriptions
- Search intent
- SERP competition
- Rich-result opportunities
- Content relevance
Impressions are therefore an important early-stage content KPI.
4. Organic Click-Through Rate
Organic CTR measures the percentage of impressions that result in clicks.
The basic formula is:
CTR = Clicks ÷ Impressions × 100
For example:
1,000 impressions
50 clicks
CTR = 5%
CTR can help determine whether your search result is compelling enough for users who see it.
Why CTR Matters
A page can rank reasonably well but receive fewer clicks than expected.
Possible reasons include:
- Weak title
- Unclear value proposition
- Search intent mismatch
- Strong competing results
- SERP features taking attention
- Poorly written meta description
Improving CTR can sometimes increase traffic without requiring the page to move dramatically in rankings.
However, CTR should always be interpreted in context because it varies substantially by query type, position, device, brand presence, and SERP layout.
5. Engagement Rate
Engagement measures whether visitors meaningfully interact with your website or content.
Google Analytics defines an engaged session as one that lasts longer than 10 seconds, contains a key event, or includes at least two page or screen views. Engagement rate is the percentage of sessions that qualify as engaged sessions.
This makes engagement rate more useful than simply assuming that a visitor who loaded a page was interested in it.
Useful Engagement Metrics
Depending on your website, you can monitor:
- Engagement rate
- Average engagement time
- Engaged sessions
- Pages per session
- Scroll activity
- Internal link clicks
- Video engagement
- CTA interactions
- Downloads
- Form interactions
Google Analytics includes engagement rate, average engagement time, engaged sessions, event counts, and key events in its reporting environment.
Important Warning
Do not assume that a high engagement rate automatically means a page is successful.
A visitor may spend several minutes reading an article and still never become a customer.
Engagement is therefore best treated as a supporting KPI that helps explain user behavior.
6. Average Engagement Time
Average engagement time indicates how long your website was actively in focus for users.
It can help answer questions such as:
- Are visitors actually consuming the content?
- Are long-form articles being read?
- Which articles keep users engaged?
- Are visitors quickly leaving after landing?
For content websites, comparing engagement time across similar articles can be particularly useful.
For example, if two articles receive similar traffic but one has significantly stronger engagement, investigate what makes it different.
It might have:
- Better formatting
- Stronger introduction
- Better examples
- More useful visuals
- Better internal linking
- Clearer answers
- Better alignment with search intent
However, time should never be treated as a universal success threshold.
A short article that answers a simple question immediately may be more successful than a long article that forces users to spend more time searching for an answer.
7. Key Events and Conversions
Conversions are among the most important content marketing measurements because they connect content with actions that matter to the business.
In modern Google Analytics terminology, a key event represents an action that is particularly important to the success of a business. Any collected event can be marked as a key event.
Examples include:
- Lead form submissions
- Product purchases
- Demo requests
- Free-trial registrations
- Newsletter signups
- Account registrations
- Downloads
- Contact requests
- Appointment bookings
For example, if a visitor reads an article and then submits a lead form, the content has contributed to a measurable business action.
Why Key Events Matter
They allow marketers to move beyond questions such as:
“How many people visited?”
and ask:
“What did those visitors actually do?”
Google Analytics can report key events and help marketers analyze the user journeys that lead to them.
8. Conversion Rate
Conversion rate measures the percentage of visitors or sessions that complete a desired action.
A basic formula is:
Conversion Rate = Conversions ÷ Relevant Visitors × 100
For example:
5,000 visitors
100 conversions
Conversion rate = 2%
But the denominator should match the business question.
You might calculate:
- Landing-page conversion rate
- Organic conversion rate
- Content-assisted conversion rate
- Session conversion rate
- Lead conversion rate
- Customer conversion rate
Why Conversion Rate Matters
Traffic tells you how many people arrived.
Conversion rate helps you understand how effectively that traffic produces a desired outcome.
If traffic increases by 50% but conversions remain unchanged, the additional traffic may not be delivering enough value.
If traffic increases by 20% and conversions increase by 60%, the quality and effectiveness of the content may be improving.
9. Content-Assisted Conversions
Not every piece of content receives the final conversion click.
A user might discover your company through a blog article, return several days later through a product page, and eventually purchase.
If you only give credit to the final page, you may underestimate the contribution of the original content.
Content-assisted conversion analysis attempts to understand the role content plays earlier in the customer journey.
This is particularly important for:
- B2B marketing
- SaaS
- High-ticket products
- Professional services
- Long sales cycles
Content can influence a buyer long before the final transaction happens.
10. Qualified Leads
For lead-generation businesses, the number of leads is often more useful than raw traffic.
But even lead volume can be misleading.
Imagine two content campaigns:
Campaign A generates 500 leads.
Campaign B generates 100 leads.
If the 500 leads are mostly unqualified and the 100 leads contain several potential customers, comparing them purely by volume does not provide a complete picture.
Therefore, track lead quality.
Useful measurements include:
- Marketing-qualified leads
- Sales-qualified leads
- Qualified opportunities
- Leads by content source
- Lead-to-opportunity rate
- Opportunity-to-customer rate
This connects content marketing with the sales pipeline.
11. Customer Acquisition Cost
Customer acquisition cost, or CAC, estimates how much it costs to acquire a customer.
A simplified formula is:
CAC = Total Acquisition Cost ÷ Number of New Customers
For content marketing, the calculation becomes more complicated because content often supports multiple channels and can continue generating traffic for months or years.
You may therefore want to calculate content-related acquisition costs using:
- Content production costs
- Writer costs
- Editing costs
- SEO tools
- Design costs
- Promotion costs
- Distribution costs
- Marketing salaries
- Agency fees
The important thing is to define your calculation consistently.
12. Cost Per Lead
Cost per lead is particularly useful for B2B content marketing.
The basic formula is:
CPL = Content Marketing Investment ÷ Number of Leads
For example:
$10,000 content investment
200 leads
CPL = $50
But a low CPL does not automatically mean strong performance.
You should also ask:
How many of those leads are qualified?
How many become opportunities?
How many become customers?
A slightly higher CPL may be acceptable if those leads have significantly higher customer value.
13. Revenue From Content
Revenue is one of the strongest business-oriented content marketing KPIs.
It answers a fundamental question:
“How much business value did our content help generate?”
Revenue measurement is easier for ecommerce businesses because purchases can often be directly associated with website sessions and marketing channels.
For B2B companies, attribution can be more complicated because multiple interactions may occur before a deal closes.
Possible measurements include:
- Revenue from organic traffic
- Revenue from content landing pages
- Revenue from content-assisted journeys
- Pipeline influenced by content
- Closed-won revenue associated with content
- Revenue per content visitor
Google Analytics can report total revenue in relevant reports, including purchase, subscription, and certain other revenue sources when the appropriate data is configured.
14. Return on Investment
Content marketing ROI attempts to determine whether the financial return from content justifies the investment.
A simple formula is:
ROI = (Revenue Attributed to Content – Content Investment) ÷ Content Investment × 100
For example:
Content investment = $20,000
Attributed revenue = $80,000
ROI = ($80,000 – $20,000) ÷ $20,000 × 100
ROI = 300%
However, attribution is often the hardest part.
Content may influence a customer without being the final interaction before purchase.
Therefore, companies should document their attribution methodology rather than presenting a single ROI number without context.
15. Customer Lifetime Value
Customer Lifetime Value, or CLV, estimates the value a customer generates over the duration of their relationship with a company.
This metric is particularly useful for subscription businesses and companies with repeat purchases.
For example, acquiring a customer for $100 may seem expensive.
But if that customer generates $5,000 over several years, the acquisition economics may look very different.
CLV becomes more powerful when compared with customer acquisition cost.
One common business question is:
“How much long-term value do customers acquired through our content generate compared with the cost of acquiring them?”
16. Backlinks
Backlinks are links from other websites to your content.
They can be useful SEO indicators because links can help search engines discover and evaluate pages, while also generating referral traffic.
Track:
- Number of referring domains
- New backlinks
- Lost backlinks
- Links to individual articles
- Quality and relevance of referring websites
- Referral traffic from backlinks
Tools such as Ahrefs and Semrush can help monitor backlink profiles.
However, do not focus purely on backlink quantity.
A few relevant links from authoritative websites may be more useful than a large number of low-quality links.
17. Referring Traffic
Backlinks and referral traffic are related but not identical.
A backlink can exist without generating significant visitors.
Referral traffic measures visitors who arrive from another website.
This helps you determine whether external mentions are actually sending people to your site.
For example, if an industry publication links to your research article and sends hundreds of relevant visitors, that referral can have value beyond the SEO benefit of the link itself.
18. Returning Visitors
Returning visitors can provide insight into whether your content gives people a reason to come back.
This can be particularly useful for:
- Publishers
- Educational websites
- News websites
- Communities
- B2B research websites
- SaaS companies
Returning visitors may indicate ongoing interest, but they should not automatically be interpreted as loyal customers.
Combine returning-user data with engagement, key events, subscriptions, leads, or purchases to understand its business value.
19. Email Signups From Content
For many websites, the goal of a blog article is not an immediate sale.
The article may instead encourage a visitor to join an email list.
Track:
- Email signups
- Signup conversion rate
- Signups by article
- Lead magnet downloads
- Email engagement
- Revenue generated from content-acquired subscribers
This helps measure the value of top-of-funnel content.
GEO vs SEO: What You Need to Know in 2026
AEO vs GEO vs SEO: Complete Comparison 2026
20. Content-to-Lead Rate
Content-to-lead rate measures how effectively content turns visitors into leads.
A basic formula is:
Content-to-Lead Rate = Leads Generated by Content ÷ Relevant Content Visitors × 100
Tracking this metric by article can reveal which topics attract high-intent visitors.
For example:
Article A: 20,000 visitors and 20 leads.
Article B: 5,000 visitors and 50 leads.
Article B receives less traffic but generates leads at a much higher rate.
That insight can influence future content planning.
21. Content-to-Customer Rate
Taking the analysis one step further, content-to-customer rate measures how effectively content contributes to acquiring actual customers.
This is especially valuable for businesses with long sales cycles.
You can analyze:
- Customers generated from organic traffic
- Customers who first interacted with a blog post
- Customers who downloaded a content asset
- Customers who entered through comparison content
- Customers influenced by educational content
This moves content reporting closer to actual business performance.
22. Content Decay
Content performance changes over time.
Some articles grow steadily.
Others peak and then decline.
Content decay occurs when an article loses traffic, rankings, engagement, conversions, or relevance over time.
Monitor pages for:
- Declining organic clicks
- Falling rankings
- Reduced impressions
- Lower conversions
- Outdated information
- Competitors publishing better resources
A content refresh can sometimes recover performance without creating an entirely new article.
23. Content Velocity
Content velocity refers to the rate at which content is produced or published.
For example:
- 5 articles per month
- 10 articles per month
- 20 videos per month
However, publishing volume should not become the main KPI.
Publishing 50 weak articles is not necessarily better than publishing 10 highly useful resources.
Track content velocity alongside:
- Organic growth
- Rankings
- Engagement
- Conversions
- Revenue
- Content quality
The purpose of content production is business and audience value, not simply publishing volume.
24. Content Efficiency
Content efficiency looks at how much value your content generates relative to the resources required to produce it.
You might calculate:
- Leads per article
- Revenue per article
- Organic traffic per article
- Conversions per $1,000 invested
- Qualified leads per $1,000 invested
This can help content teams decide where to invest resources.
For example, if a specific content format consistently produces qualified leads at a lower cost, you may want to investigate why it performs well and whether the approach can be replicated.
How to Choose the Right Content Marketing KPIs
The biggest mistake is trying to track everything.
A better approach is to start with the business objective.
If Your Goal Is Brand Awareness
Consider tracking:
- Impressions
- Reach
- Organic visibility
- Branded searches
- Direct traffic
- Relevant audience growth
- Video views
- Mentions
If Your Goal Is SEO Growth
Track:
- Organic clicks
- Organic impressions
- CTR
- Average position
- Keyword visibility
- Organic landing pages
- Referring domains
- Organic conversions
If Your Goal Is Lead Generation
Track:
- Leads
- Qualified leads
- Lead conversion rate
- Cost per lead
- Content-assisted leads
- Sales-qualified leads
- Opportunities
If Your Goal Is Ecommerce Revenue
Track:
- Organic revenue
- Product views
- Add-to-cart events
- Purchases
- Revenue per visitor
- Conversion rate
- Average order value
- Customer acquisition cost
If Your Goal Is Customer Retention
Track:
- Returning customers
- Repeat purchases
- Customer lifetime value
- Retention rate
- Customer engagement
- Product usage
- Email engagement
The key principle is simple:
Your KPI should match the job the content is supposed to perform.
How to Build a Content Marketing KPI Framework
A useful framework can be divided into five stages.
Stage 1: Visibility
Ask:
“Are people discovering our content?”
Track:
- Impressions
- Organic clicks
- Rankings
- Reach
- Referring traffic
Stage 2: Engagement
Ask:
“Are people consuming and interacting with the content?”
Track:
- Engagement rate
- Average engagement time
- Scroll activity
- Internal clicks
- Video completion
- Downloads
Stage 3: Conversion
Ask:
“Are users taking meaningful actions?”
Track:
- Key events
- Leads
- Signups
- Demo requests
- Purchases
- Conversion rate
Stage 4: Revenue
Ask:
“Is content contributing to business growth?”
Track:
- Revenue
- Pipeline
- Customers
- Customer acquisition cost
- Customer lifetime value
Stage 5: Efficiency
Ask:
“Are we getting enough value from our content investment?”
Track:
- Cost per lead
- Cost per customer
- Revenue per article
- ROI
- Content production cost
- Content efficiency
This framework prevents content teams from focusing exclusively on traffic.
How to Create a Content Marketing KPI Dashboard
A dashboard should make performance easier to understand, not create another complicated reporting task.
A basic dashboard could include:
SEO Performance
- Organic clicks
- Organic impressions
- CTR
- Average position
- Organic sessions
Content Engagement
- Engagement rate
- Average engagement time
- Engaged sessions
- Scroll interactions
- Internal clicks
Lead Generation
- Leads
- Qualified leads
- Conversion rate
- Cost per lead
Sales
- Opportunities
- Customers
- Revenue
- Customer acquisition cost
Financial Performance
- Content investment
- Revenue attributed to content
- ROI
- Customer lifetime value
Tools that can be used include Google Analytics, Google Search Console, Looker Studio, Semrush, Ahrefs, CRM platforms, and spreadsheet-based reporting.
How Often Should You Measure Content KPIs?
Not every KPI needs to be reviewed at the same frequency.
Weekly
Useful for monitoring:
- Traffic changes
- Major ranking changes
- Technical problems
- Significant conversion changes
- Campaign performance
Monthly
Useful for:
- Content performance
- Organic growth
- Lead generation
- Conversion rates
- Top-performing articles
- Content decay
Quarterly
Useful for:
- Revenue contribution
- ROI
- Customer acquisition
- Content strategy
- Topic performance
- Content investment decisions
Annually
Useful for:
- Overall content strategy
- Year-over-year growth
- Customer lifetime value
- Acquisition economics
- Budget allocation
- Long-term content ROI
The frequency should depend on the size and speed of your business.
Common Content Marketing Measurement Mistakes
Mistake 1: Measuring Traffic Without Quality
More traffic is not always better.
A website can increase traffic while generating fewer qualified leads.
Always analyze traffic quality.
Mistake 2: Treating Rankings as Revenue
A top ranking is not the same as a sale.
Rankings are an SEO indicator.
Revenue is a business outcome.
Use both, but do not confuse them.
Mistake 3: Using Industry Benchmarks as Universal Targets
There is no single conversion rate that every website should achieve.
Conversion rates vary by:
- Industry
- Audience
- Traffic source
- Device
- Offer
- Price
- Search intent
- Brand awareness
- Customer journey
Your historical performance and business economics are often more useful than arbitrary universal targets.
Mistake 4: Ignoring Attribution
Customers often interact with multiple pieces of content before purchasing.
A final-click-only approach may undervalue content that introduced or educated the customer.
Use an attribution approach that matches your business and sales cycle.
Mistake 5: Tracking Too Many KPIs
A dashboard with 50 metrics may look sophisticated but can make decision-making harder.
Start with a small set of metrics that directly connect to your goals.
A Simple Content Marketing KPI Template
Here is a practical starting framework:
| Objective | Primary KPI | Supporting Metrics |
|---|---|---|
| SEO growth | Organic conversions | Clicks, impressions, CTR, rankings |
| Brand awareness | Relevant reach | Impressions, branded searches, mentions |
| Engagement | Engagement rate | Engagement time, scrolls, interactions |
| Lead generation | Qualified leads | Conversion rate, CPL |
| Sales | Revenue | Customers, pipeline, conversion rate |
| Ecommerce | Organic revenue | Purchases, AOV, conversion rate |
| Efficiency | ROI | Cost per lead, CAC, revenue |
| Retention | Customer lifetime value | Repeat purchases, retention |
The primary KPI should represent the main objective.
Supporting metrics explain why the primary KPI changed.
How to Track Link Building ROI
Broken Link Building Step by Step
How AI Search Changes Content Measurement
Search behavior is changing as users increasingly interact with AI-powered search and answer systems.
This creates additional questions for content teams:
- Is the brand being mentioned in AI-generated answers?
- Is content being cited as a source?
- Are users discovering the brand through AI search?
- Does the content provide direct answers to complex questions?
- Is the website becoming a trusted source for a specific topic?
Traditional SEO metrics remain important, but content teams may increasingly need to combine them with broader measures of visibility and brand discovery.
However, AI visibility should not replace business KPIs.
A brand mention or citation can be useful evidence of visibility, but the business should still investigate whether that visibility contributes to qualified traffic, leads, customers, or revenue.
Some current content-performance frameworks already include AI visibility and AI citations alongside traditional metrics such as organic traffic, engagement, and conversions.
Content KPIs for AI Overviews and Answer Engines
For content designed to perform well in AI-powered search experiences, consider monitoring:
- Search impressions
- Organic clicks
- Brand mentions
- AI citations where measurable
- Referral traffic
- Branded searches
- Topic authority
- Content coverage
- Entity visibility
- Conversion activity
A useful strategy is to create content that clearly answers important questions and provides original information, examples, data, explanations, or first-hand expertise.
The objective is not simply to create longer content.
It is to create content that is useful enough to be discovered, referenced, understood, and acted upon.
The Most Important KPI Is Different for Every Business
There is no universal list of “the ten most important content marketing KPIs.”
The right metrics depend on your business model.
For example:
A publisher may prioritize engaged users, subscriptions, and advertising revenue.
An ecommerce company may prioritize purchases and organic revenue.
A B2B company may prioritize qualified leads and pipeline.
A SaaS company may prioritize trials, activation, paid conversions, and lifetime value.
A local business may prioritize calls, bookings, direction requests, and leads.
Therefore, start with the business objective and work backward.
Business goal → Content goal → User action → KPI → Supporting metrics
This approach creates much more useful reporting.
A Practical Example
Imagine a B2B software company publishes 20 articles in six months.
The content team reports:
- 150,000 page views
- 20,000 social impressions
- 5,000 new followers
Those numbers may look positive.
But management wants to know whether content is helping the business.
The team investigates further.
The content generated:
- 8,000 organic sessions
- 400 content-related leads
- 120 qualified leads
- 35 sales opportunities
- 10 new customers
- $100,000 in associated revenue
Now the company has a much clearer understanding of content performance.
The team can investigate which articles generated the qualified leads and customers.
Perhaps only five articles generated most of the commercial value.
That information can guide future content investment.
How to Improve Content Performance Using KPIs
Measurement is only useful when it leads to action.
Use your KPI data to make decisions.
If impressions are increasing but clicks are not:
Review titles, search intent, and SERP presentation.
If traffic is increasing but engagement is declining:
Check content quality and audience relevance.
If engagement is strong but conversions are weak:
Review CTAs, offers, landing pages, and user intent.
If leads are increasing but sales are not:
Investigate lead quality and sales follow-up.
If sales are increasing but content costs are also increasing rapidly:
Review content efficiency and production processes.
If rankings are falling:
Investigate content decay, search intent, competition, freshness, internal linking, and overall page quality.
This turns analytics into an optimization system rather than a monthly reporting exercise.
Frequently Asked Questions About Content Marketing KPIs
What are the most important content marketing KPIs?
The most important KPIs depend on your business goals, but commonly include organic traffic, search visibility, engagement, key events, conversions, qualified leads, revenue, customer acquisition cost, customer lifetime value, and ROI.
What is the most important content marketing metric?
There is no single metric that is most important for every business. For many businesses, revenue and qualified conversions are closer to business outcomes than traffic or engagement metrics.
How do you measure content marketing success?
Measure content marketing success by connecting content activity to business outcomes. A typical framework is visibility → engagement → conversion → revenue → ROI.
Is organic traffic a good content marketing KPI?
Yes. Organic traffic is useful for measuring search visibility and audience acquisition, but it should be combined with engagement and conversion metrics to understand business impact.
How do you calculate content marketing ROI?
A simplified formula is:
ROI = (Revenue Attributed to Content – Content Investment) ÷ Content Investment × 100
Because attribution can be complicated, companies should clearly define what revenue and costs are included.
What is a good content marketing conversion rate?
There is no universal conversion rate that applies to every website. Conversion rates depend on factors such as industry, audience, traffic source, offer, device, price, and intent. Use historical performance and business-specific benchmarks whenever possible.
Should content marketers track page views?
Page views can be useful as a traffic and reach indicator, but they should not be treated as proof that content generated business value.
What KPIs should SEO content track?
SEO-focused content can track:
- Organic clicks
- Impressions
- CTR
- Average position
- Keyword visibility
- Organic traffic
- Engagement
- Key events
- Leads
- Revenue
What KPIs should a B2B content marketing team track?
B2B teams should consider:
- Organic traffic
- Qualified leads
- MQLs
- SQLs
- Opportunities
- Pipeline
- Customers
- Revenue
- Cost per lead
- Customer acquisition cost
- ROI
What KPIs should ecommerce content track?
Ecommerce content teams can track:
- Organic traffic
- Product-page visits
- Add-to-cart events
- Purchases
- Conversion rate
- Revenue
- Average order value
- Organic revenue
- Customer acquisition cost
- Customer lifetime value
Final Thoughts
Content marketing measurement should be about more than proving that content is being published.
The real question is whether content is helping the business achieve meaningful goals.
Traffic, rankings, impressions, and engagement can tell you whether people are discovering and interacting with your content.
Conversions, qualified leads, customers, revenue, and ROI tell you whether that activity is contributing to business performance.
The strongest content marketing measurement strategy connects these levels together.
Start with the business objective.
Define the action you want users to take.
Choose a primary KPI.
Add supporting metrics that explain performance.
Then review the data consistently and use it to improve your content strategy.
Instead of asking:
“How much content did we publish?”
or:
“How many page views did we get?”
ask:
“Did our content attract the right audience, create meaningful engagement, generate valuable actions, and contribute to business growth?”
That is the difference between simply measuring content and actually measuring content marketing performance.

